
NDVI (Normalized Difference Vegetation Index) measures vegetation vigour by comparing the red and near-infrared light it reflects: NDVI = (NIR − Red) / (NIR + Red). It ranges from −1 to +1: water gives negative values, bare soil values close to 0 and healthy, dense vegetation high values. To see the NDVI of your field you need a cloud-free satellite image clipped to its boundary; in Orcelis, all you need is the plot drawn on the map and to open «Imágenes satelitales» (satellite images) in the crop record.
Orcelis’s screens are in Spanish; button and menu names are shown as they appear in the app.
What NDVI is
NDVI (Normalized Difference Vegetation Index) is the most widely used vegetation index in agriculture. It is based on a simple physical fact: the chlorophyll in a healthy leaf absorbs red light for photosynthesis, while the leaf’s internal structure strongly reflects near-infrared (NIR).
That is why it is calculated as follows:
NDVI = (NIR − Red) / (NIR + Red)
The more green, active vegetation there is in a pixel, the further apart the two bands are and the higher the NDVI. A stressed or diseased plant, or one with little leaf mass, reflects less infrared and the index drops.
What NDVI values mean
These ranges are indicative and work for any crop as a first reading:
| NDVI | Usual interpretation |
|---|---|
| Below 0 | Water, clouds or snow |
| 0 to 0.2 | Bare soil, rock, stubble |
| 0.2 to 0.4 | Sparse vegetation, newly established or stressed crop |
| 0.4 to 0.6 | Moderate vegetation |
| Above 0.6 | Dense, vigorous vegetation |
What matters is not the number on its own, but how it changes: between dates for the same field and between areas within the same field. A patch that drops while the rest holds steady is what deserves a visit.
Limitations you should know about
- Clouds and shadows. They distort the value. Discard dates with heavy cloud over the field.
- Soil between rows. In orchards, vineyards or olive groves the pixel mixes canopy and alley, so the average is lower than in a closed field crop.
- Cover crops and weeds. They are green too and raise the index.
- Saturation. In very dense vegetation NDVI stops picking up differences; EVI helps there.
- Pixel size. Small fields have few pixels and the edges carry a lot of weight.
NDVI does not diagnose the cause: it tells you where vigour is lower, not why. The cause (water, nutrition, pests, frost, missing plants) is confirmed in the field.
How to see your field’s NDVI in Orcelis
In Orcelis, NDVI is calculated over the actual boundary of each of the crop’s plots. Satellite images are included in the Pro plan with the satellite module.
- Check that the crop has its plots drawn on the map. Without a boundary there is nothing to clip.
- In the crop record, go to Acciones / Operaciones › Imágenes satelitales (Actions / Operations › Satellite images). The first time, Orcelis connects the plots to the satellite automatically; when it is ready you will see datos en vivo (live data).
- Choose the date in the strip below the map. Each date shows the percentage of nubes (clouds) and cobertura (coverage) of the plot.
- In the Capa (layer) card, leave NDVI or switch to EVI, EVI2, NDWI and other indices. Satélite shows the photo without an index so you can check that the plot is correctly positioned.
- Read the date’s statistics: maximum, mean, median, minimum, standard deviation, number of pixels and Kc estimado (estimated Kc).
- In Histórico · NDVI de la temporada (history · season NDVI) look at the trend and widen the date range if you want to compare with earlier months.
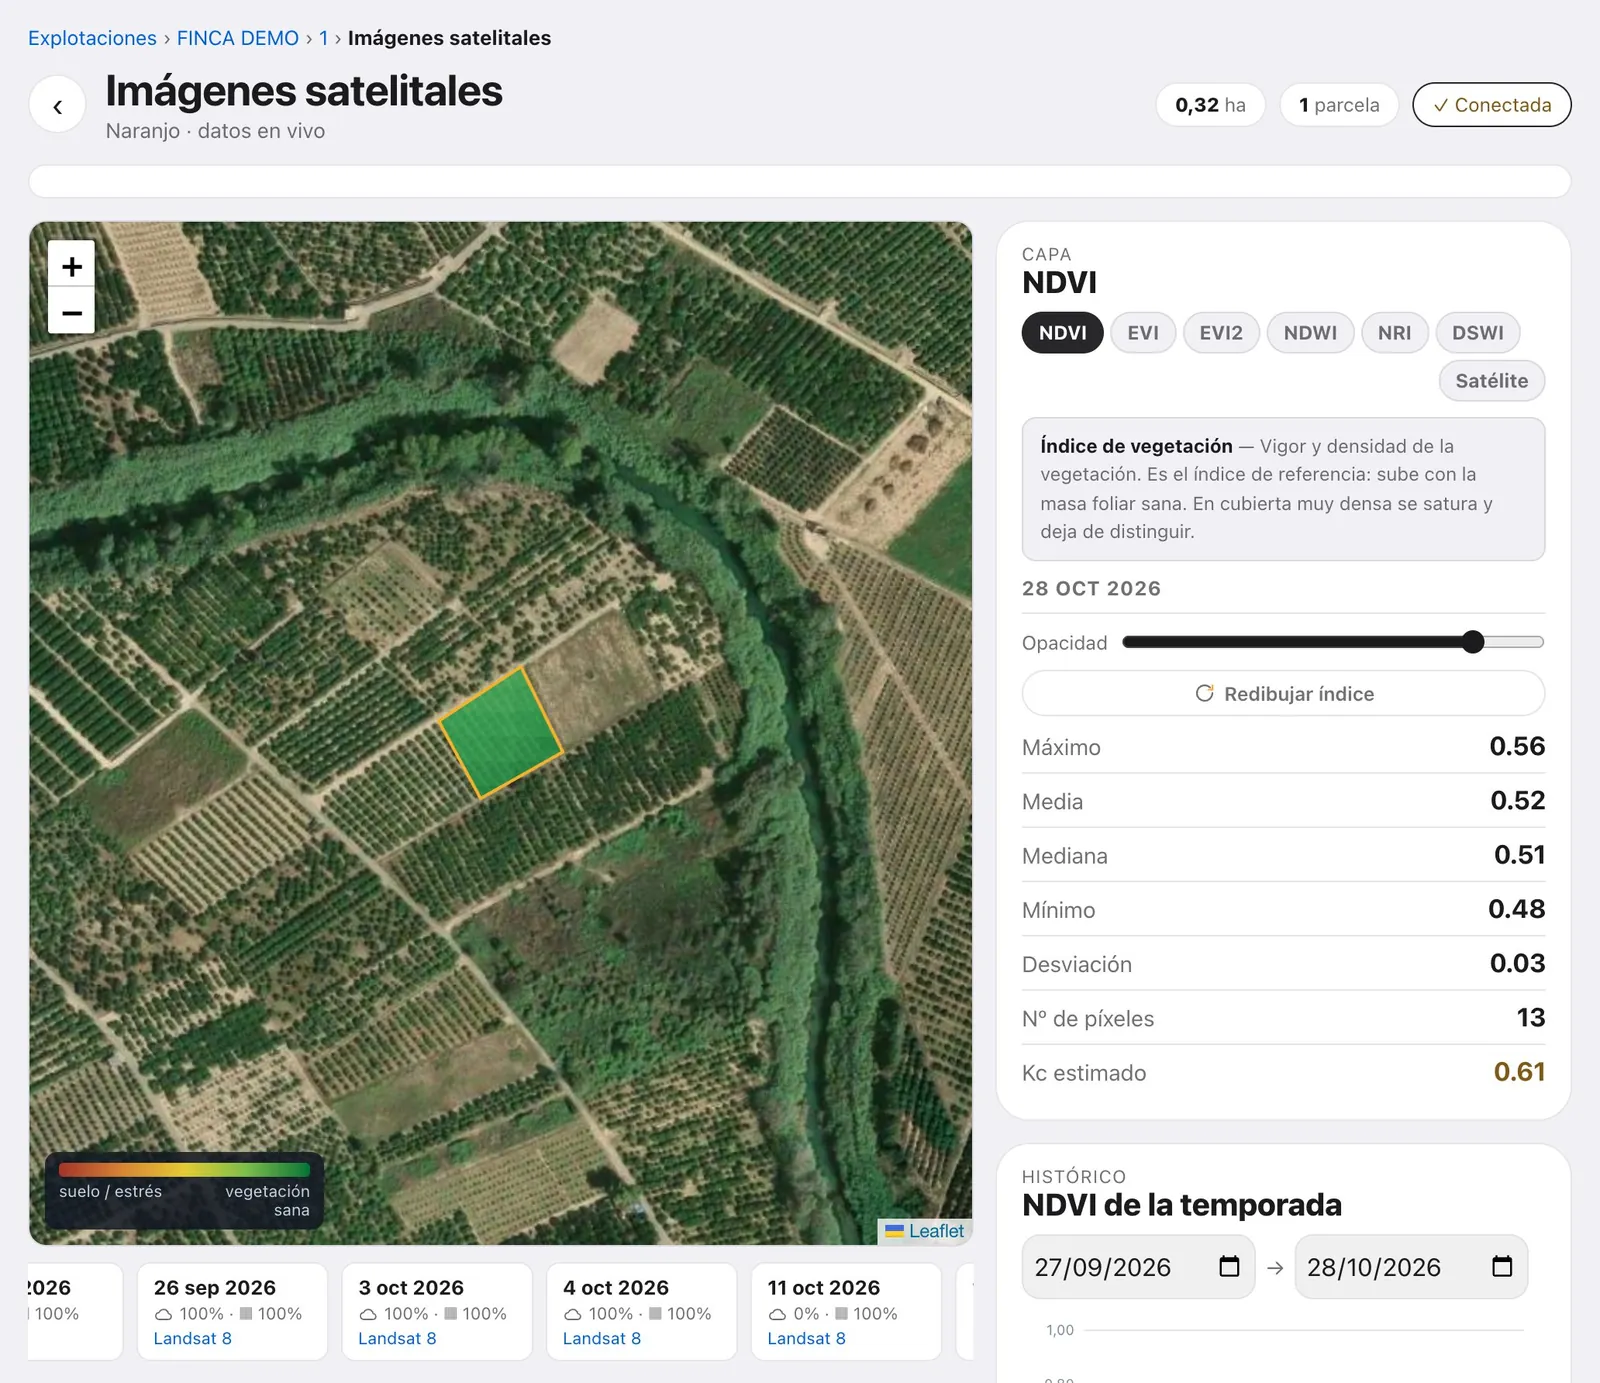
If the colour spills outside the plot or appears in patches, click «Redibujar índice» (redraw index). Adjust the Opacidad (opacity) to see the ground beneath the colour.
The advantage of doing it in Orcelis is that NDVI sits alongside the rest of the crop’s data: the calculated irrigation, the field logbook and the treatments. If you see a drop, you can check in the same record what was irrigated and what was applied in those weeks.
Frequently asked questions
What is a good NDVI value?
There is no universal good value. As a guide, above 0.6 usually indicates dense, vigorous vegetation, and below 0.2 bare soil or very sparse vegetation. It depends on the crop, the planting spacing and the point in the cycle, so the useful thing is to compare your field with itself over the season.
Why does my healthy orchard have a low NDVI?
In woody crops each pixel mixes canopy and soil between rows. If the alley is bare, the field average drops even though the trees are fine. Conversely, a cover crop or weeds raise it. Always interpret it bearing in mind the state of the soil.
How often is there a new image?
Satellites pass over the same area several times a month, but cloudy dates are no use for measuring NDVI. In cloudy periods you can go weeks without a clean image. Always check the cloud percentage for each date.
Can NDVI be used to decide irrigation?
It helps, but it does not replace calculating crop water requirements. NDVI is related to crop cover and therefore to the crop coefficient (Kc). An unexpected drop in NDVI is a signal to go to the field and check irrigation, pests or nutrition.
How does NDVI differ from EVI or NDWI?
EVI corrects for soil and atmospheric effects and saturates less in very dense canopies. NDWI uses water-sensitive bands and relates to the water content of vegetation. NDVI remains the reference index because it is simple and comparable.
Can I see NDVI if the field is small?
Yes, but with few pixels. Each pixel in free satellite imagery covers tens or hundreds of square metres, so in small fields the edges carry a lot of weight. Look at the number of pixels in the statistics before drawing conclusions.