
The water footprint of a crop is the volume of fresh water needed to produce one unit of harvest, usually expressed in litres per kilo (l/kg, which is the same as m³/t). Under the Water Footprint Network methodology it has three components: blue (irrigation water consumed), green (rainwater evapotranspired by the crop) and grey (the water needed to dilute pollutants, such as leached nitrogen, down to water quality standards). It is calculated by dividing the water of each component per hectare by the yield.
Orcelis’s screens are in Spanish; button and menu names are shown as they appear in the app.
What the water footprint is
The water footprint is an indicator of the fresh water behind a product. The concept was proposed by Arjen Hoekstra in 2002 and the reference methodology is the one in the Water Footprint Assessment Manual (Hoekstra, Chapagain, Aldaya and Mekonnen, 2011), published by the Water Footprint Network.
For a crop it is expressed per unit of harvest: litres per kilo (l/kg) or cubic metres per tonne (m³/t), which is the same thing. That makes it possible to compare seasons, plots and management practices with a single figure.
The three components: blue, green and grey
| Component | What it measures | What it depends on |
|---|---|---|
| Blue | Irrigation water (surface or groundwater) consumed by the crop: water evapotranspired or incorporated into the harvest | Irrigation and its efficiency |
| Green | Rainwater stored in the soil and evapotranspired by the crop | The local climate and the year |
| Grey | The volume of water needed to dilute the pollutants reaching water bodies (for example, leached nitrogen) down to their quality standard | Fertilisation and the quality standard applied |
An important nuance: the blue water footprint is not the water applied, but the water consumed. Water that percolates and returns to the aquifer is not counted as blue.
How to calculate it, step by step
The total footprint is the sum of the three: WF = WF green + WF blue + WF grey. Each component is calculated per hectare and divided by the yield.
- Green and blue: start from the crop’s evapotranspiration over the season, separating the part covered by effective rainfall (green) from the part covered by irrigation (blue). Each millimetre over one hectare is 10 m³. That volume (m³/ha) is divided by the yield (t/ha), giving m³/t, that is, l/kg.
- Grey: WF grey = (α × AR) / (cmax − cnat) / Y. Here α is the fraction of the pollutant that reaches water through leaching or runoff, AR is the application rate (kg/ha), cmax the maximum acceptable concentration, cnat the natural concentration in the receiving water body and Y the yield.
For nitrogen, the Water Footprint Network’s global studies have often used a leaching fraction of 10%. The quality standard usually taken is the one for nitrate in drinking water: in the European Union, 50 mg/l of nitrate under Directive (EU) 2020/2184.
Worked example
A crop yielding 40 t/ha, which evapotranspires 200 mm of rain and 450 mm of irrigation, and receives 200 kg/ha of nitrogen:
- Green: 200 mm × 10 = 2,000 m³/ha; divided by 40 t/ha = 50 l/kg.
- Blue: 450 mm × 10 = 4,500 m³/ha; divided by 40 t/ha = 112.5 l/kg.
- Grey: with α = 10%, 20 kg/ha of N reaches water. The 50 mg/l nitrate limit is equivalent to about 11.3 mg/l of nitrogen. Diluting it requires about 1,770 m³/ha; divided by 40 t/ha = about 44 l/kg.
- Total: about 207 l/kg.
These are made-up figures to illustrate the method, not reference values for any crop.
How to read it and how to reduce it
- High blue: may indicate irrigation above crop needs. Matching irrigation to actual evapotranspiration is the most direct lever.
- High grey: fertilisation weighs heavily. Matching the nitrogen rate to what the crop removes, and splitting it, reduces leaching.
- Green: depends on rainfall; it cannot be controlled through management.
- Yield: since it divides everything, producing more with the same water lowers the footprint.
The Water Footprint Network’s water footprint is a volume indicator. The ISO 14046 standard defines a different approach, based on life cycle assessment and impacts. If a customer or a certification scheme asks you for your water footprint, ask which methodology they expect.
How to see the water footprint in Orcelis
Orcelis calculates the water footprint of each crop with its own data and compares it with a reference for its species.
- Open the crop record and go to Acciones / Operaciones › Huella hídrica (Actions / Operations › Water footprint), or click the Huella hídrica box in the Panel (dashboard) tab.
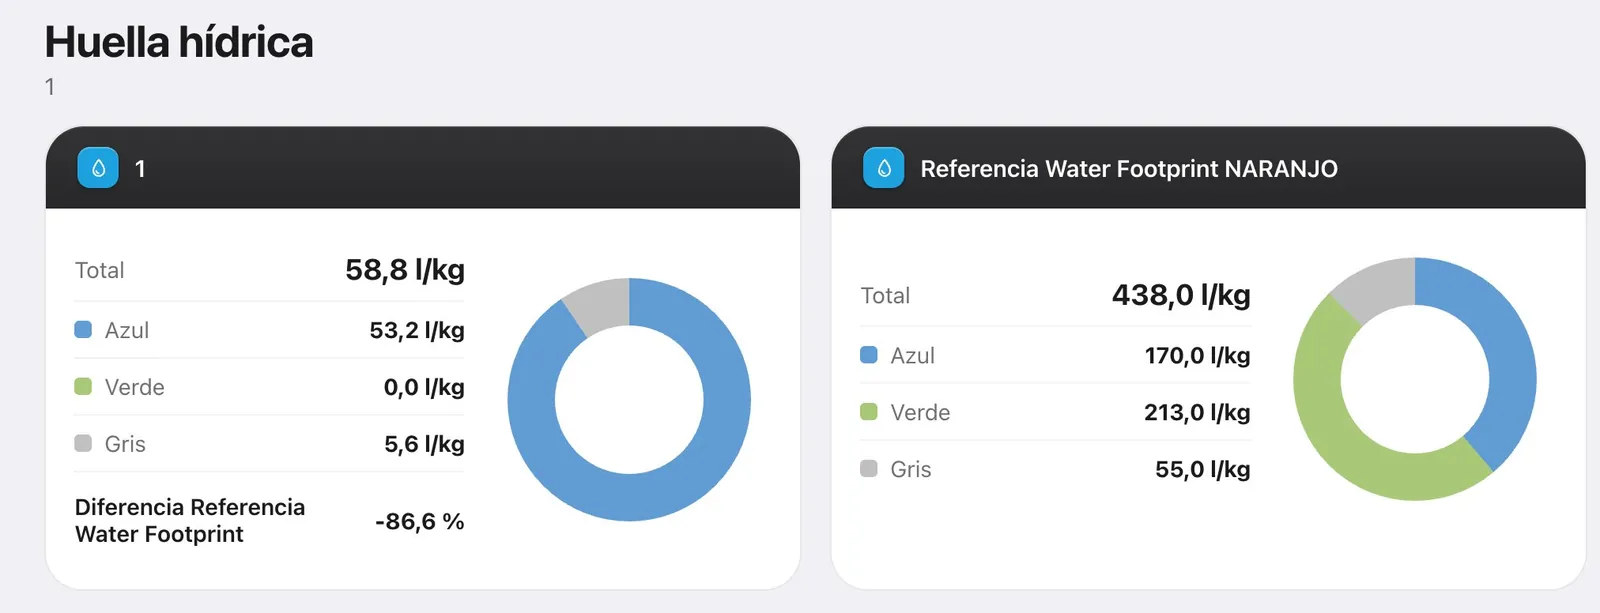
- On your crop’s card you will see the Total, Azul (blue), Verde (green) and Gris (grey), in l/kg, and a pie chart showing the split.
- The Diferencia Referencia Water Footprint line tells you, as a %, how far you are from the reference: with a + sign you use more water per kilo; with a − sign, less.
- Next to it, the Referencia Water Footprint card shows the same values for the species, so you can compare colour by colour.
The País (country) set in your account determines the nitrate limit Orcelis uses to calculate the grey footprint. If the footprint cannot be calculated, check that the Datos del cultivo (crop data) tab is complete. Because irrigation and fertilisation come from the same software, you can go from the footprint figure to the fertigation calculation and correct it without switching tools.
Frequently asked questions
Is the water footprint the same as the irrigation water applied?
No. The blue footprint counts the irrigation water consumed, that is, what the crop evapotranspires or incorporates. Water that percolates deep and returns to the aquifer is not part of the blue footprint. Moreover, the total footprint adds the green and the grey.
Why is the green footprint out of my control?
Because it comes from the rain that falls on the plot and stays in the soil. It depends mainly on the local climate and the year. What you do control is the blue, through well-matched irrigation, and the grey, through well-matched fertilisation.
Can I compare the footprint of an orange tree with that of an olive tree?
It doesn’t make much sense. Each species has very different water needs and yields. Compare your crop with the reference for the same species or with your own previous seasons.
Sources
- Mekonnen, M. M. and Hoekstra, A. Y. (2011). The green, blue and grey water footprint of crops and derived crop products. Hydrology and Earth System Sciences, 15, 1577–1600
- Water Footprint Network
- ISO 14046:2014 Environmental management. Water footprint
- Directive (EU) 2020/2184 on the quality of water intended for human consumption